
QNOPY Atlas: GIS Mapping Built for Environmental Projects

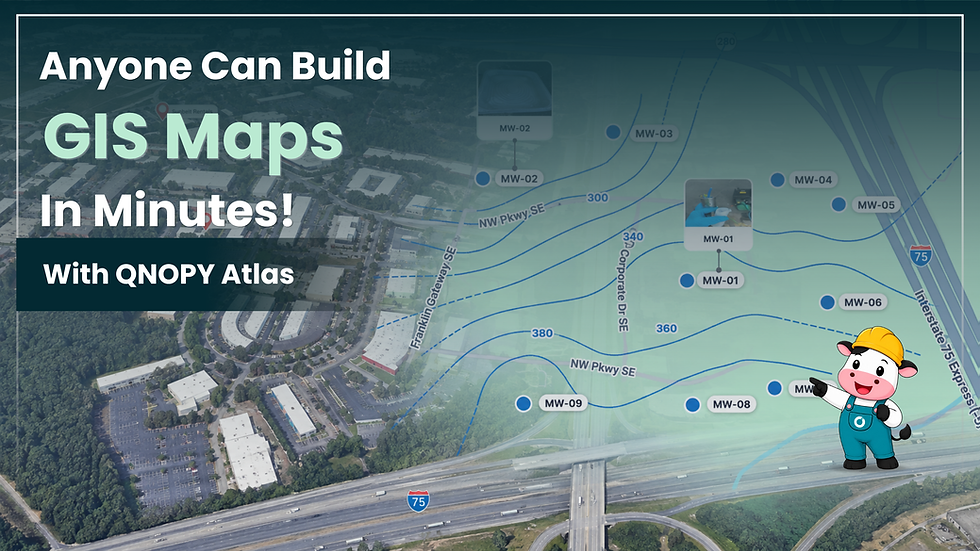
Environmental projects generate a tremendous amount of location-based information—sampling locations, field observations, laboratory results, photos, site boundaries, groundwater elevations, and more. But turning all that information into useful maps has traditionally required dedicated GIS software, specialized training, and additional processing.
QNOPY Atlas changes that.
Atlas is QNOPY’s built-in GIS mapping tool, designed specifically for environmental projects. It allows project teams to bring field and laboratory data directly onto a map, visualize results geographically, create project figures, and share them—all within QNOPY.
No separate GIS software to install. No specialized GIS training required.
Your Project Data, Already on the Map
Because Atlas is integrated directly with QNOPY, the information your team collects can become part of your map without having to move data between multiple applications.
Atlas can work with:
Field Data – Display sampling locations, measurements, observations, and other field information.
Lab Data – Visualize analytical results geographically and create data-driven project figures.
KML Data – Bring existing geographic information into your project.
Photo Layers – View project photos in their geographic context.
Drawing Layers – Add boundaries, lines, shapes, labels, and other map features.
Contour Layers – Generate and display groundwater elevation contours.
Databox Layers – Present laboratory and other project data directly alongside locations.
Project Layers – Organize the geographic information relevant to each project.
Instead of treating GIS as a separate step at the end of a workflow, Atlas makes mapping part of the project itself.

What Can You Do With QNOPY Atlas?
1. View All Your Project Locations on a Map
See wells, borings, sampling points, inspection locations, and other project features together on an interactive basemap. Your team gets an immediate geographic view of the site and the work being performed.
2. Create Site Boundary Maps
Draw or display project and site boundaries directly in Atlas. This makes it easy to establish the geographic context of your project without opening a separate GIS application.
3. Delineate Zones and Areas
Use drawing tools to identify areas of concern, sampling zones, excavation limits, investigation areas, or other project-specific regions.
4. Create Databox Figures With Laboratory Results
Turn analytical results into clear, location-based figures. Databoxes allow you to display relevant laboratory results alongside sampling locations so reviewers can quickly understand both what was detected and where it was detected.
5. Create Groundwater Elevation Contours With One Click
Groundwater contouring can traditionally require moving data into specialized software and manually preparing a figure.
With Atlas, groundwater elevation data can be used to generate contour lines directly on the project map with a click.
6. Adjust and Refine Your Contours
Automated contours are a starting point—not a limitation. Atlas gives users the ability to tweak the generated contours so the final figure appropriately represents site conditions and professional interpretation.
7. Mark Features Directly on the Map
Add lines, shapes, labels, boundaries, and other features to communicate important site information. Project teams can build useful figures without needing advanced GIS experience.
8. Export Maps to PDF
Once your map is ready, export it to PDF for reports, project documentation, client deliverables, or internal review.
9. Export Data to KML
Need to continue working with your project data outside QNOPY?
Export your geographic project information to KML and continue visualizing it in other GIS, mapping, and visualization software. This gives teams flexibility to use Atlas within QNOPY while still supporting workflows that require external applications.
10. Share Maps and Control Access
Maps don't have to remain trapped on one person's computer.
Share Atlas maps with your project team or other stakeholders and control whether each person can view or edit the map. Teams can work from the same geographic information without emailing GIS files and multiple versions back and forth.
GIS Without the GIS Learning Curve
The biggest advantage of Atlas isn't simply that it can create maps. It's that it makes geographic visualization accessible to the people already working with the project data.
No GIS training required. Atlas is designed with an intuitive interface so environmental professionals can create and work with maps without becoming GIS specialists.
No software installation. Atlas is built into QNOPY, eliminating the need to install and maintain a separate desktop GIS application for everyday project mapping.
Faster workflows. Field data, laboratory results, photos, project locations, and maps can all live within the same platform. That means less time exporting, importing, reformatting, and transferring information between systems.
Flexible output. Build and share maps within QNOPY, export them to PDF for project deliverables, or export geographic data to KML when you need to continue working in other software.
From Field Data to Map to Deliverable
Atlas is part of a larger idea behind QNOPY: environmental project information shouldn't live in disconnected applications.
Field teams collect information in QNOPY. Laboratory results are managed in QNOPY. Photos and project locations are already there. Atlas brings that information together geographically and helps turn it into something immediately useful.
Collect the data. See it on the map. Build the figure. Share it with your team. Export the deliverable—or take the data with you into other mapping software.
All within QNOPY.
Meet QNOPY Atlas
Whether you're mapping sampling locations, reviewing analytical results, preparing groundwater contours, delineating project areas, or creating figures for a report, Atlas gives environmental professionals the GIS capabilities they need without the complexity of traditional GIS software.
QNOPY Atlas — environmental GIS mapping, built directly into your project workflow.
See it in Action, Book a demo now.


Comments