
Streamlining groundwater monitoring for a 1,000 wells program


One of the largest environmental and infrastructure consulting companies in the world has been using the QNOPY platform for managing groundwater monitoring activities at high profile remediation sites located in California’s Mojave desert for the last couple of years. The monitoring program is complex and the number of wells sampled in any quarter exceeds 1,000. With the QNOPY platform the consultant has been able to achieve 30% reduction in costs as well as better quality of data with zero re-work and zero data lost. Following case study describes the overall project setup and results achieved:
Project setup:
Over 1,000 monitoring wells
Complex sampling plan with multiple overlapping sampling programs
Sampled by 7 to 10 samplers from a labor subcontractor
Analytical data is managed by another subcontractor
Site is in a remote area with spotty to no cellular data coverage
Challenges
Complex regulatory requirements translate into complex sampling plans
Well IDs are often mislabeled in the field
Wrong wells are sampled as the well IDs are similar and technicians accidentally put wrong well ID on the forms
Since the technicians constantly switch they sometimes sample the same well twice
Planning the sampling event and making sure each well is assigned to a sampler using excel is a challenge
There are overlapping sampling programs which call for different types of analysis.
Manual QA of the daily sampling work is a challenge
There is a constant pressure to reduce costs and add efficiencies
QNOPY solution overview
QNOPY customized the groundwater monitoring forms for the program to include all the unique requirements. The projects were set up in the QNOPY system and all the wells were added into the database with their construction details such as their depth to bottom, diameters, and the screen intervals. Geographic locations of the wells were also updated into the QNOPY database.
Following are some of the key features of the QNOPY solution:
QNOPY provided cellular tablets along with the software subscription
QNOPY mobile app works offline – meaning it does not need internet connectivity
Each technician has a unique login and can see all the wells and their completion status
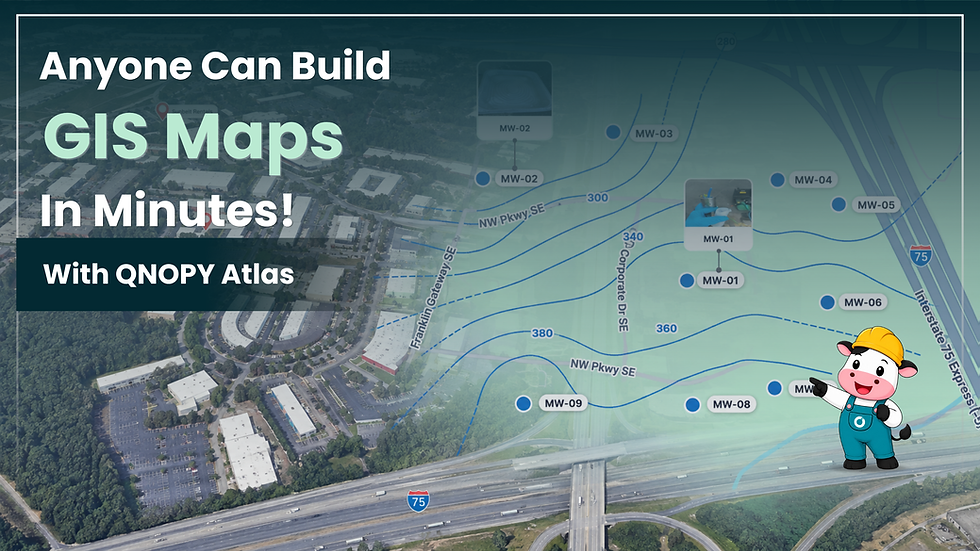
Wells can be seen on a map making them easier to find in open spaces
Photos taken along with the well integrity checklist are automatically attached to the well and to the form
The app automatically populates the well diameter and the total well depth so that the technicians can confirm the well
All the data collected is exported as EDDs for import in the other proprietary databases
Mobile app shows last 2 readings on the side for quick reference
Each parameter has a valid range which can be based on the historic data or just hard limits
Parameter stabilization criteria is pre-loaded and QNOPY app calculates the difference between two sets and shows it in green or orange color indicating stabilization
Sampling plan for each well is pre-loaded and is then available in the mobile app
Technicians see the types and number of sample containers or bottles to fill
Project manager has access to the data as it is recorded in the field via QNOPY’s web portal. The PM has the following capabilities on the web portal:
View and edit sampling plan for wells
Add new wells or edit old wells – update TOC, DTB etc.
Live data view shows the field data in a tabular format which can be edited by the project engineer or exported as word, excel, or pdf
If the field technicians entered the data for a wrong well the PM can move the data under the right well using the “Swap Data” feature
Collected data is exported in EDD format for import into the other database system
Final field forms are exported as PDF with the well photos attached under the right well
Field data can be plotted as time series

Results Achieved
Reduced the overall cost of project management by 30%
Close to 8,000 samples collected and field data recorded with the QNOPY tablets in last two years
Zero duplication of work in last 2 years
Zero loss of data in the last 2 years
Not a single tablet damaged or lost
Significantly reduced the time taken for data cleanup. With the EDD export, database managers simply upload one EDD for the whole event
No typos in the well IDs helps the lab data upload process
Every data point is geotagged and timestamped
Got photos for every well box
Provided better visibility and transparency
Following are some example time series plots for a well

To learn more contact us at info@qnopy.com.
By: Saurabh Gogate
Date: February 2, 2017


Comments